This function finds the unique tags of items in the quotes database and returns them as vector or a one-way table giving their frequencies.
Value
Returns either a vector of tags in the quotes database or a one-way frequency table of the number of quotes for each tag.
Examples
quote_tags()
#> [1] "anthropophony" "collections" "communication" "entomology"
#> [5] "listening" "museums" "ornithology" "physics"
#> [9] "poetry" "silence" "terminology"
quote_tags(table=TRUE)
#> tags
#> anthropophony collections communication entomology listening
#> 1 1 1 6 7
#> museums ornithology physics poetry silence
#> 1 5 1 7 2
#> terminology
#> 1
library(ggplot2)
qt <- quote_tags(table=TRUE)
qtdf <-as.data.frame(qt)
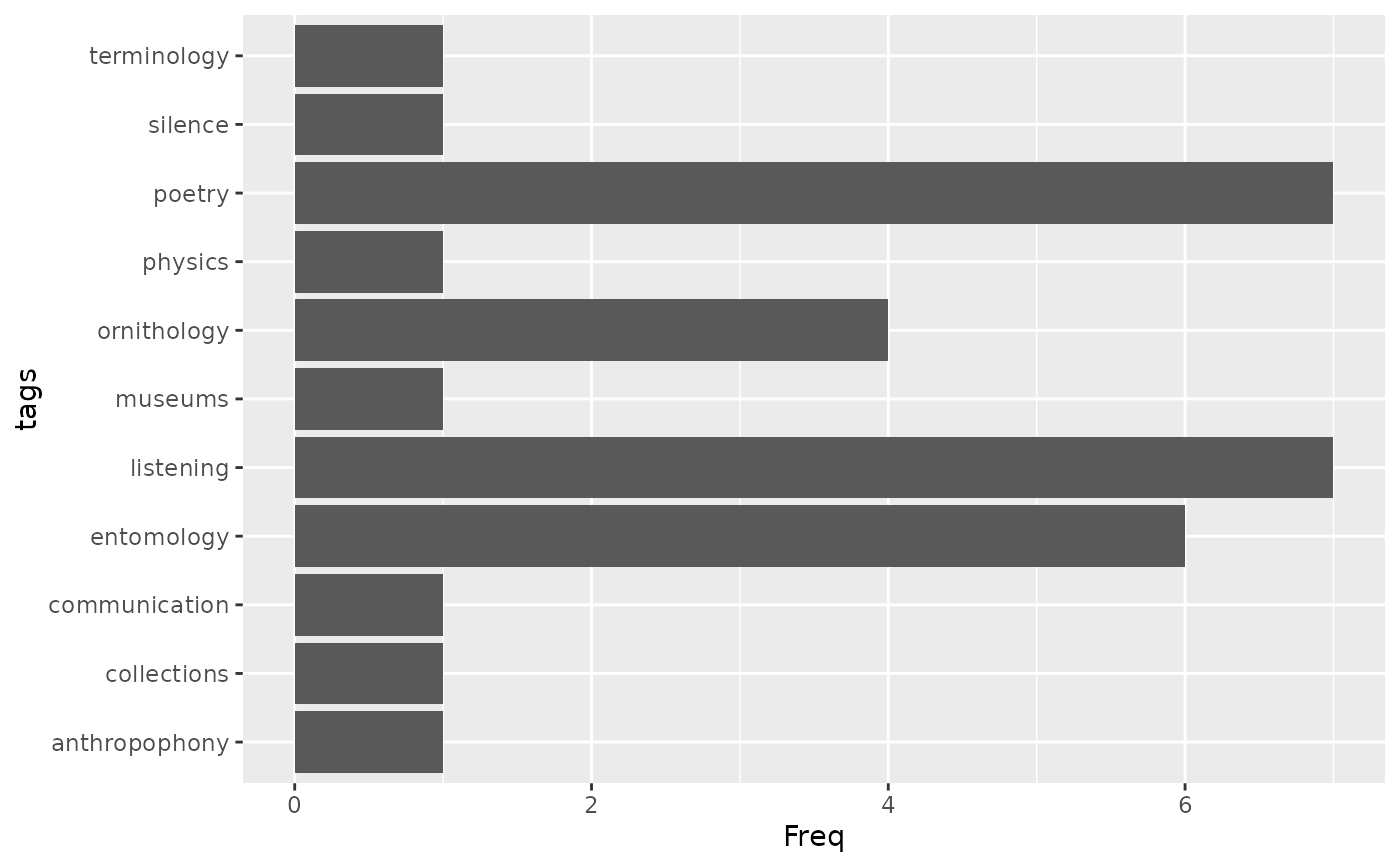
# bar plot of frequencies
ggplot2::ggplot(data=qtdf, aes(x=Freq, y=tags)) +
geom_bar(stat = "identity")
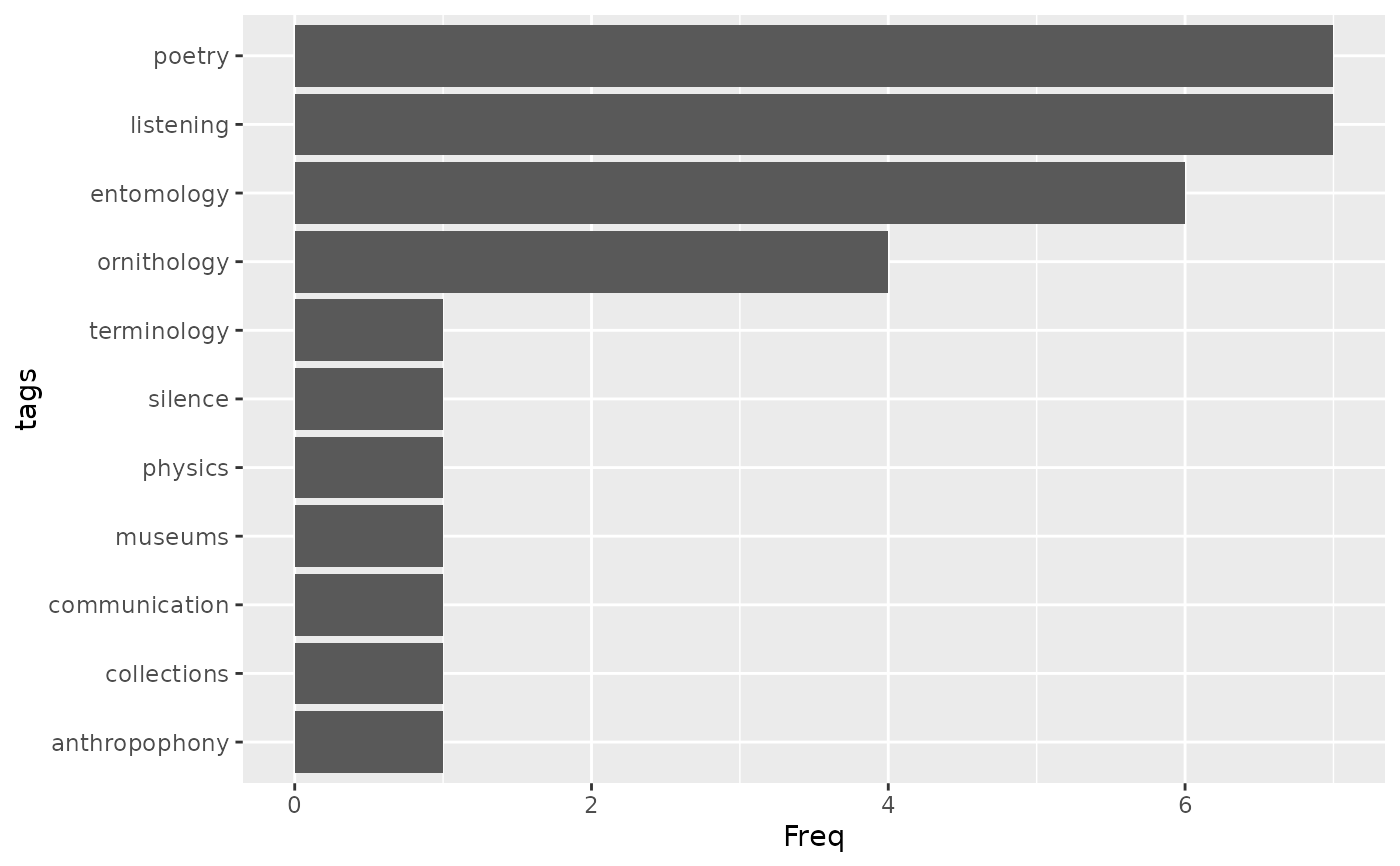
 # Sort tags by frequency
qtdf |>
dplyr::mutate(tags = forcats::fct_reorder(tags, Freq)) |>
ggplot2::ggplot(aes(x=Freq, y=tags)) +
geom_bar(stat = "identity")
# Sort tags by frequency
qtdf |>
dplyr::mutate(tags = forcats::fct_reorder(tags, Freq)) |>
ggplot2::ggplot(aes(x=Freq, y=tags)) +
geom_bar(stat = "identity")